

 hide
hide
 show operations
BioCyc Tools for Analysis of Transcriptomics and Proteomics Data
BioCyc offers multiple tools for analysis of transcriptomics and proteomics data. Here we provide an overview of these tools with screen snapshots and links to start live execution of the tools on example datasets:- Visualize Gene-Expression Data on Metabolic Network Diagram
- Visualize Gene-Expression Data on Single Pathway Diagram
- Analyze Transcriptomics Data using the Omics Dashboard
- Enrichment Analysis
Detailed tool usage instructions can be found in this section of the BioCyc Website User's Guide.
Transcriptomics and proteomics data are both handled by these tools, the only difference being that the supplied input file contains gene names or identifiers versus protein names or identifiers.
In each of the examples below, the tool analyzes transcriptomics data provided in a tab-delimited file. The data are from an RNA-Seq experiment in which E. coli transition from anaerobic to aerobic growth (von Wulffen et al, PMID 27384956), and has been normalized using the TPM approach using tools external to BioCyc. The last section on this page describes the file format used and links to the full data file used in these examples.
Always begin your omics data analysis sessions by selecting the organism in which the omics data has been measured. This step is required because the gene identifiers used in the input files are tied to specific organisms, and also because each organism has its own unique metabolic network diagram.
Visualize Gene-Expression Data on Metabolic Network Diagram
This tool colors reaction arrows in the metabolic-map diagram with colors indicating gene-expression levels (such as from RNA-Seq) to visualize activation levels of metabolic pathways. Datasets with multiple data columns are animated, and the diagram can be zoomed.Click here to invoke the tool on this example data; click here to invoke the tool on data you provide.
Example screen capture:
Visualize Gene-Expression Data on Single Pathway Diagram
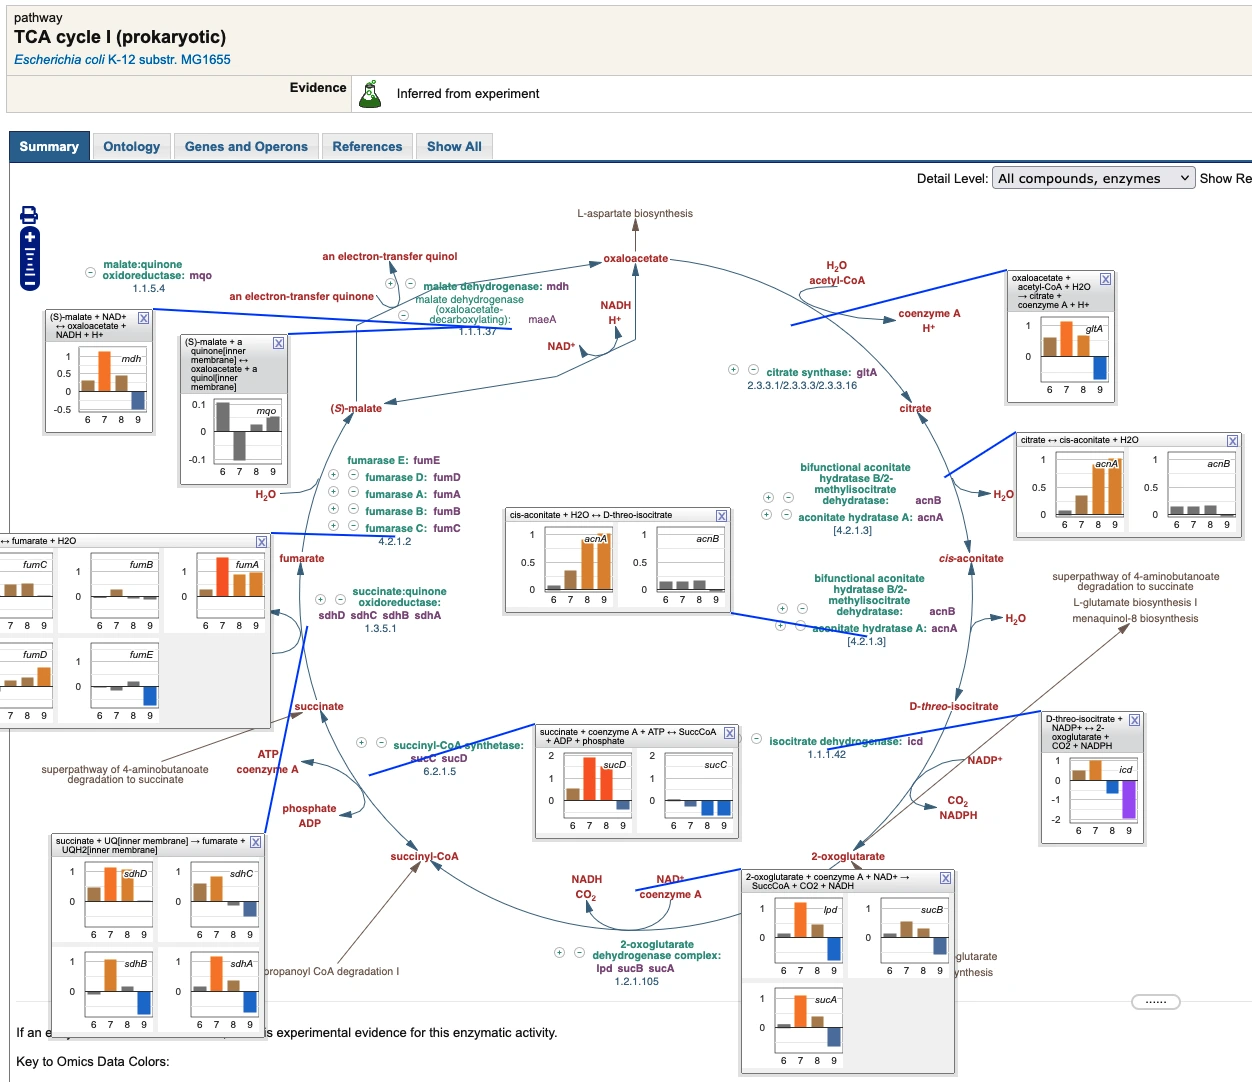
This tool displays "omics pop-up graphs" depicting gene-expression levels onto single pathway diagrams to facilitate assessment of pathway activation levels.Click here to invoke the tool on this example data; click here to invoke the tool on data you provide.
Example screen capture:
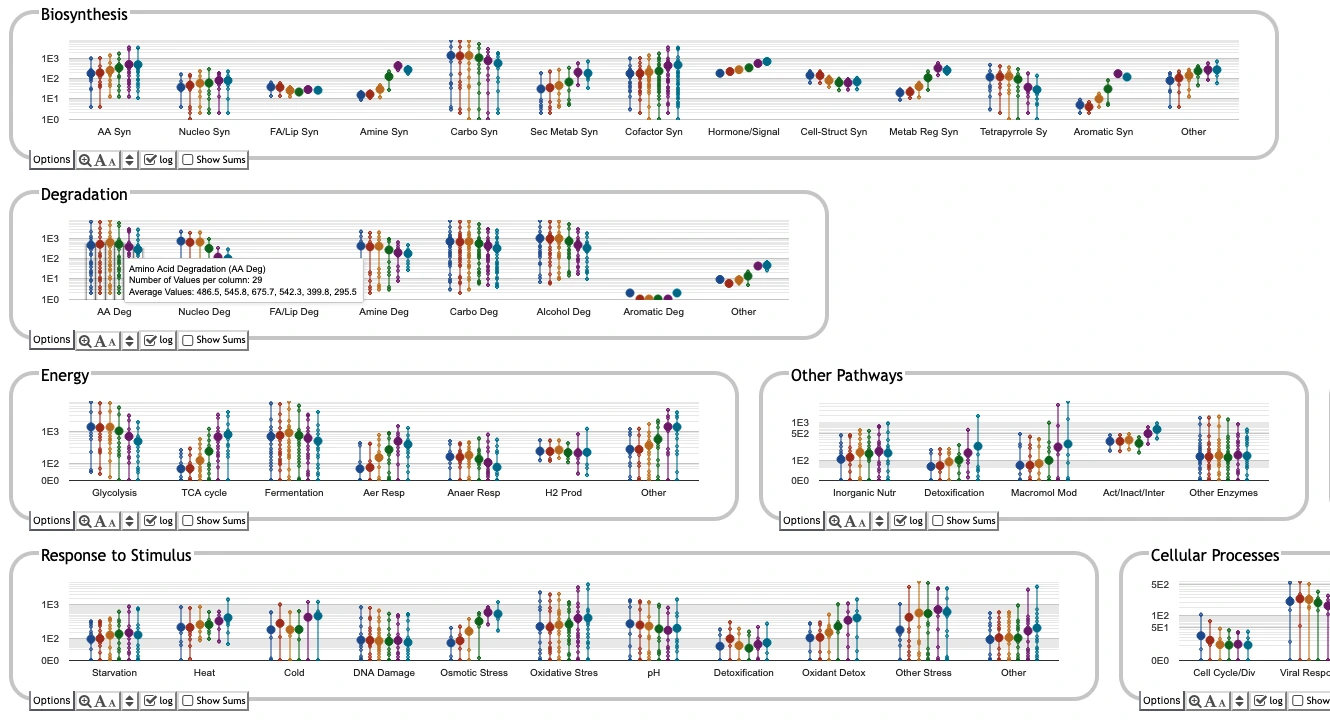
Analyze Transcriptomics Data using the Omics Dashboard
Visualize gene expression data as a hierarchically organized set of bar graphs, summarizing results by a variety of biological functional categories, and enabling the user to drill down into specific areas of interest by clicking on a graph. The upper left graph depicts all genes involved in amino-acid biosynthesis, with each time point shown as one vertical line. Dots are gene expression levels; the thick dots average all genes in that time point.Click here to invoke the tool on this example data; click here to invoke the tool on data you provide.
Example screen capture:
Enrichment Analysis
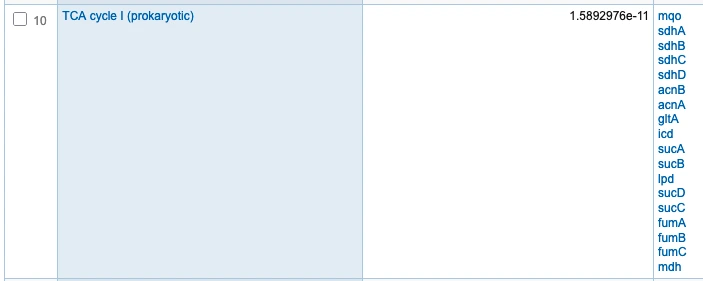
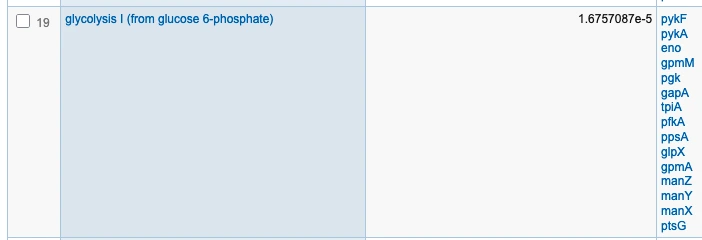
Given a set of genes identified as differentially regulated across two conditions, Enrichment Analysis identifies those biological processes that contain more differentially regulated genes than would be expected by chance. For example, the set of genes might contain more genes involved in L-lysine biosynthesis than would be expected by chance. BioCyc can perform enrichment analyses with respect to three types of biological processes: metabolic pathways, Gene Ontology biological processes, and transcriptional regulatory processes.In this analysis with respect to metabolic pathways, the TCA Cycle and glycolysis pathways were among those found to show enrichment for the differentially regulated genes. The output lists the enriched pathways, the probability the enrichment would occur by chance, and and the pathway genes in the input gene set.
Transcriptomics File Format and Example File
The transcriptomics data to be analyzed is imported into each of the above tools from a tab-delimited file provided by the user that is stored on the user's computer. Each line of the file contains data for a single gene (or protein for proteomics data). Lines beginning with "#" are comment lines and are ignored by BioCyc. The first column of each line contains a gene name or identifier (or protein name or identifier for proteomics data); additional columns (separated by one tab character) contain one or more data values.In our short example file below, the first column (which is called column 0) contains the gene name trpA and the gene identifier b0383. The remaining columns 1-4 contain transcript abundance values from four different time points. Note that data normalization is performed prior to importing the data into BioCyc.
The full data file used for the above examples can be downloaded here.
# Sample E. coli K-12 transcriptomics file. # # In this file the data columns are columns 1-4 # trpA 3.2 3.8 4.3 8.6 b0383 1.1 4.2 2.9 7.5